The December national indicators showed improving overall housing market activity. Looming interest rate hikes prompted homebuyers to lock in mortgage rates during a typically slower time of the year.
The total number of unsold homes nationwide is down 16.1% from December 2020. This is a minor improvement from November’s 16.2% decline as the inventory share of listings in pending status increased slightly, a sign that buyers are active even with fewer options from which to choose.
Nationally, the inventory of homes for sale in December decreased by 26.8% over December 2020 and marked the third month in a row where the rate of decline increased compared to the previous month in 2020.
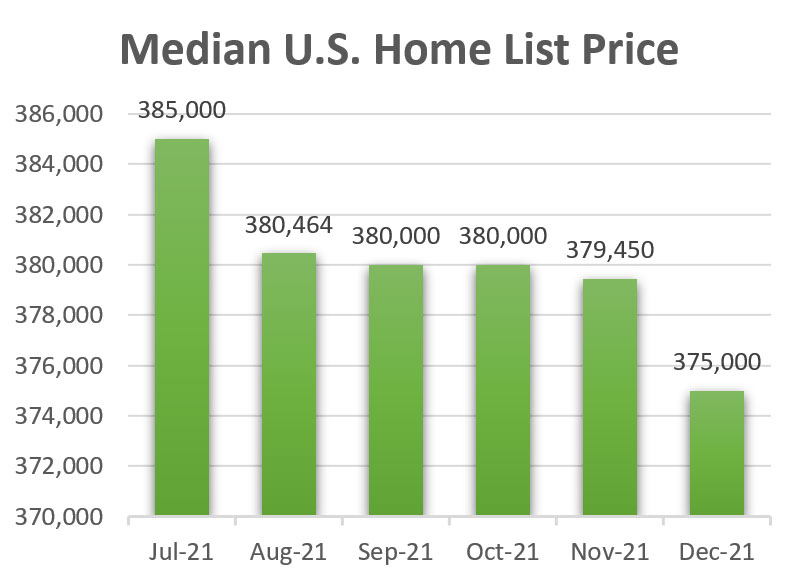
Home Median List Price Drops1
- According to Realtor.com, the median list price of homes for sale in December was $375,000, down 1.17% from November’s $379,450.
- December’s home median price is 9.97% higher than December 2020.
- Home median prices reached a high of $385,000 in June and July.
 Purchases Of New Homes Rose2
- New single-family home sales increased 12.4% to 744,000 units in November from the seasonally adjusted annual rate (SAAR) October pace of 662,000 units.3
- Overall, new home purchases in December were 14% lower than in 2020.
Sales of Existing Homes Increased for a Third Straight Month4
- The National Association of Realtors® (NAR) reported that November sales of existing homes (including single-family homes, townhomes, condominiums, and cooperatives) rose 1.9% to 6.46 million units (SAAR) from the October pace of 6.34 million homes.
- The November sales were 2% below November 2020.5
- Interest rates remained low in December, but lean inventories and the growth of home prices are constraining sales.
New Home Construction Rebounded2
Total housing starts rose 11.8% to 1.68 million units (SAAR) in November and were up 8.3% from one year ago.
- Single-family housing starts increased 11.3% to 1.17 million homes (SAAR) in November from October (1.05 million), which is marginally lower (0.8%) than November 2020.
- Multifamily housing starts (5+ units in a structure), at 491,000 units (SAAR), is an increase of 12.1% from October (438,000 units) and 39.1% higher than 2020.
Year-Over-Year Home Price Increases Slowed Again in October, With Annual Gains Ranging From 17.4 to 18.4%6
- The Federal Housing Finance Agency (FHFA) seasonally-adjusted, purchase-only house price index for October estimated that home values increased 1.08% from September and 17.4% year-over-year, down from a 17.8% annual gain in September.7
- This is the third consecutive month that annual price gains slowed following a fourteen-month acceleration.
- The FHFA index shows that U.S. home values are 59% above the peak set in April 2007 during the housing bubble.
Inventory of New Homes for Sale Rose but Fell for Existing Homes2
- The listed inventory of new homes for sale (402,000 units) at the end of November increased 2.6% from October and was up 38.6% over November 2020.
- The inventory supply would support 6.5 months of sales at the current sales pace, which is down from October (7.1 months) due to the sharp gain in November sales.
- Available existing homes for sale, at 1.11 million units in November, were down 9.8% from the previous month, which is 13.3% lower than 1.23 million units in November 2020.
- November’s listed inventory represents a 2.1-month supply, down from October (2.3 months). The long-term average for the month’s supply of homes on the market is 6.0 months.
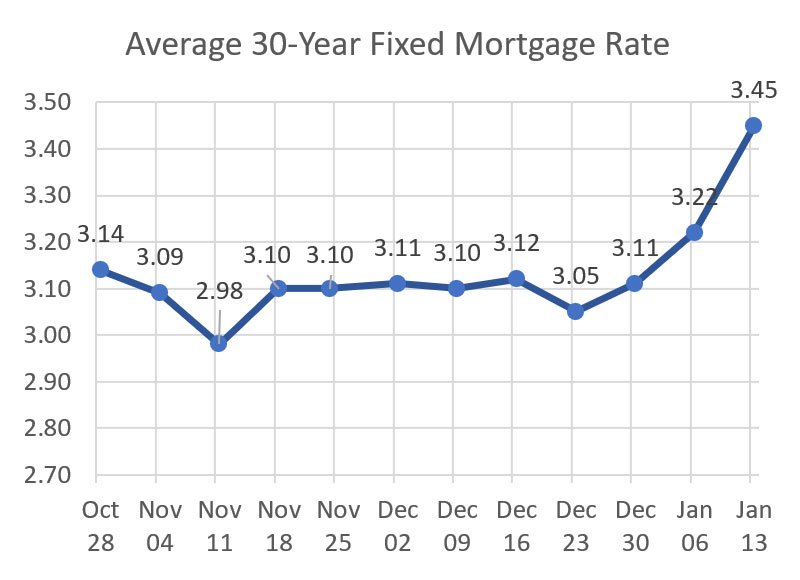
30-Year Fixed-Rate Mortgage (FRM) Rose Above 3%8
- The 30-year FRM reached an average weekly low in December of 3.05% for the week ending December 23, up from a low in November of 2.98% (week ending November 10).
- The record weekly low interest rate is 2.65% for the week ending January 7, 2021.9
- The 30-year FRM was 2.67% at the end of December 2020.9
 Americans Borrowed More Than Ever to Buy Homes In 202110
- Mortgage Bankers Association estimates that mortgage lenders issued $1.61 trillion in purchase loans in 2021, which is up slightly from $1.48 trillion in 2020.
- The previous record was $1.51 trillion in 2005.
- Rising mortgage rates have slowed the wave of refinances that have driven the boom in mortgage lending since the spring of 2020.
- The Federal Reserve is expected to raise rates in 2022.
- When rates go up, fewer homeowners can refinance and lower their monthly payments.
Sources:
1 Realtor.com residential listings database
2 HUD Housing Market Indicators Monthly Update, December 2021
3 New home sales are based on purchase agreement signings rather than on closings, as is the case with existing homes.
4 Because existing home sales are based on a closing, November sales reflect contract signings in September and October.
5 National Association of Realtors
6 Federal Housing Finance Agency (FHFA)
7 The home price data for both indices are based on real estate sales contracts signed in late August and September with subsequent closings during October. (Both price indices are released with a 2-month lag.)
8 Freddie Mac
9 FRED, Federal Reserve Bank of St. Louis
10 Mortgage Bankers Association estimates

