National housing market indicators available as of November showed overall improvement. While home values are trending upward in most larger markets, the inventory is trending down, suggesting the winter months will be a more competitive market in many areas of the country.
Due to the inventory shortage, many homeowners have been reluctant to put their homes on the market even though they could sell for top dollar. With a limited number of homes available for sale, about 25% of current homeowners choose not to sell because of the difficulty in finding an affordable new home. However, it appears conditions are improving as more homeowners are planning to sell in the next six months.
This past year, homeowners who did sell found the real estate market dominated by multiple bids, price escalation clauses, contingency waivers, and all-cash offers.
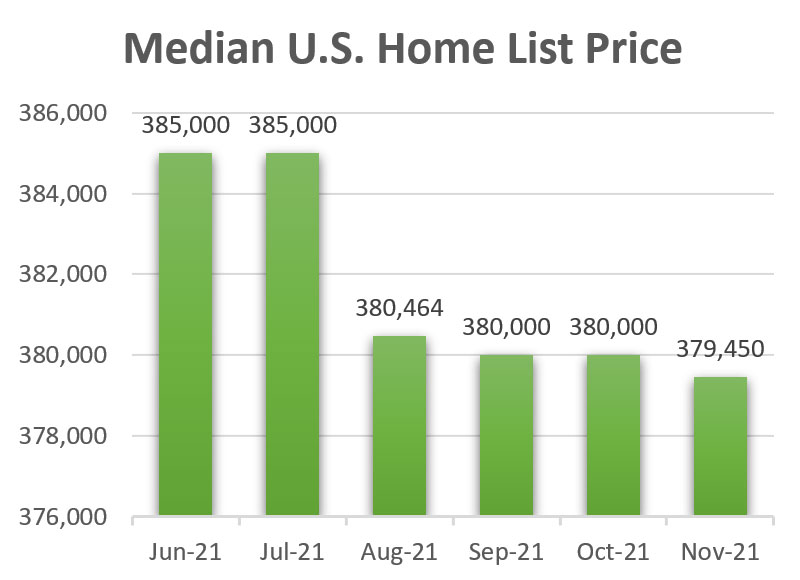
Home Median List Price Drops Slightly1
- According to Realtor.com, the median list price of homes for sale in November was $379,450, down slightly from October’s $380,000.
- November’s home median price is 8.65% higher than November 2020.
- Home median prices reached a high of $385,000 in June and July.

New Home Purchases Rose Slightly2
- New single-family home sales increased 0.4% to 745,000 units seasonally adjusted annual rate (SAAR) in October from a revised pace of 742,000 units in September. Still, they were 23.1% lower than one year ago.3
- Sales were up in the Midwest and the South but down in the Northeast and West Census regions.
Existing Home Sales Increased for the Second Straight Month4
- The National Association of Realtors® (NAR) reports October sales of existing homes (including single-family homes, townhomes, condominiums, and cooperatives) rose slightly (0.8%) to 6.34 million units (SAAR) from a pace of 6.29 million in September but were 5.8% below a year earlier.5
- Sales were up in the Midwest and South, down in the Northeast, and held steady in the West.
- Interest rates are low, but lean inventories and house price growth are constraining sales.
New Home Construction Slipped2
- Total housing starts were down 0.7% to 1.52 million units (SAAR) in October, but year-over-year were marginally higher (0.4%).
- Single-family housing starts fell 3.9% to 1.04 million homes (SAAR) in October, down from 1.08 million in September and were 10.6% lower than last year.
- Multifamily housing starts (5+ units in a structure) increased 6.8% (470,000 units from 440,000 units) in September (SAAR).
- Multifamily housing starts were 39.5% higher than last year.
- Lumber prices, which were high during the pandemic and had been easing in recent months, shot up in October; other supply chain and labor issues in some markets continue to constrain homebuilding.
- The main challenge for builders is navigating fluctuating costs like lumber prices, which have risen to $1,100 per thousand board feet since the summer low of $400, along with the continuing shortage of labor.1
Year-Over-Year House Price Increases Slowed in September6
- Annual gains ranged from 17.7% to 19.1%.
- The Federal Housing Finance Agency (FHFA) seasonally-adjusted purchase-only house price index for September estimated that home values increased 0.9% from August and 17.7% year-over-year, down from an 18.5-percent annual gain in August.7
- November was the second consecutive month that annual price gains slowed following a fourteen-month acceleration.
- The FHFA index shows that U.S. home values are 57% above the peak set in April 2007 during the housing bubble and 100% above the low point reached in March 2011.
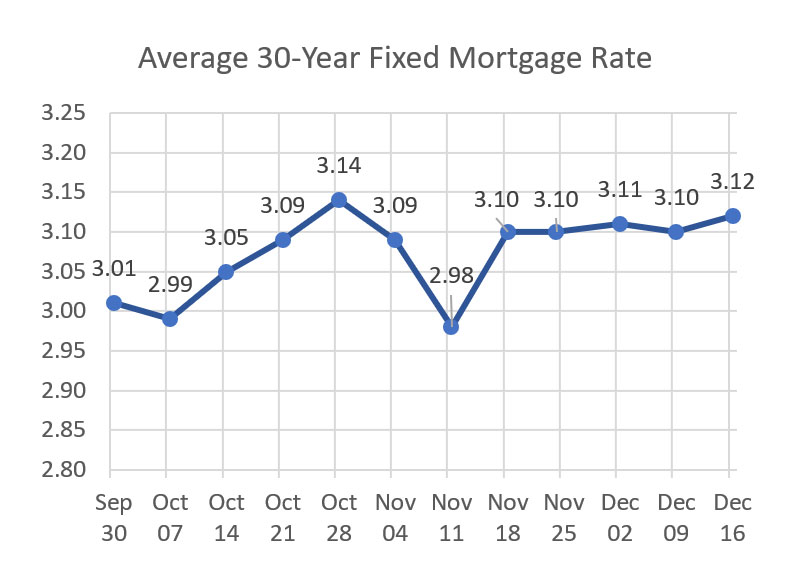
The 30-Year Fixed-Rate Mortgage (FRM) Remained Relatively Steady8
- The 30-year FRM reached an average weekly low in November of 2.98% the week ending November 10, down marginally from a low in October of 2.99% the week ending October 7.
- The weekly 30-year FRM in mid-December stood at 3.12%.
- The record weekly low interest rate is 2.65% the week ending January 7, 2021.9
- The 30-year FRM was 2.72% one year ago.

Sources:
1 Realtor.com residential listings database
2 HUD Housing Market Indicators Monthly Update, November 2021
3 New home sales are based on purchase agreement signings rather than on closings, as is the case with existing homes.
4 National Association of Realtors
5 Because existing home sales are based on a closing, October sales reflect contract signings in August and September. Interest rates are low, but lean inventories and house price growth are constraining sales.
6 Federal Housing Finance Agency (FHFA)
7 The home price data for both indices are based on real estate sales contracts signed in late July and August, with subsequent closings during September. (The FHFA price indices are released with a 2-month lag.)
8 Freddie Mac
9 FRED, Federal Reserve Bank of St. Louis

