The U.S. housing market remains active. Housing market indicators released in October show market activity improving overall. However, home list prices remain high due to tight inventory and high demand.
Since many sellers are also hopeful homebuyers, the low supply of available homes for sale makes the decision to sell more difficult. Experts hope that increased construction will help ease the home supply demand in the coming year; otherwise, it will be challenging for the housing market to climb out of this pattern.
Ralph B. McLaughlin, chief economist and senior vice president of analytics at Haus, Inc., predicts that housing demand will cool this fall. However, he doesn’t expect inventory to recover fully until next spring. Likewise, Frank Nothaft, chief economist at CoreLogic, agrees that the housing supply is a long way from meeting the demand. Nevertheless, Nothaft is cautiously optimistic, noting that inventory is rising thanks partly to lumber prices easing.
Historically, the fall months have less competition for homes. But the pandemic has altered that trend, with many cities seeing housing prices increase by double-digit percentages.
Median Home List Price
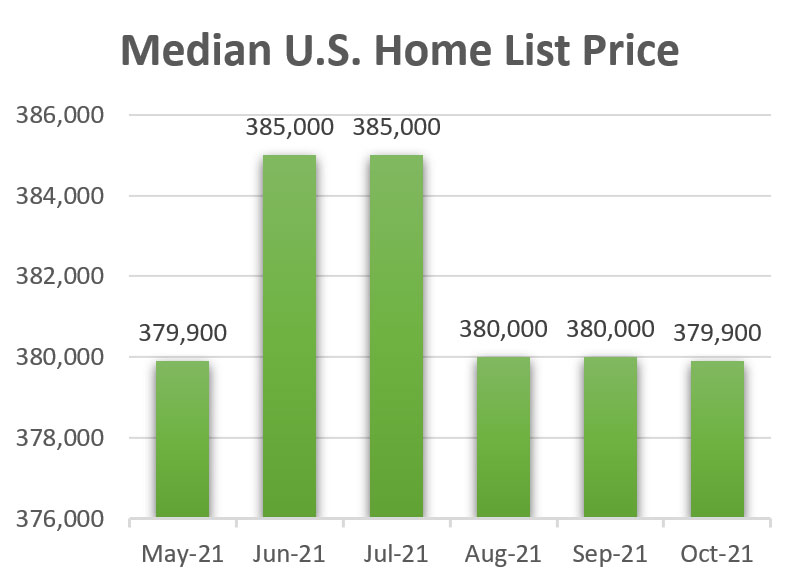
- The United States median home list price for October was $379,900, which was down slightly (0.03%) from September.1
- The October median home list price is up 8.57% compared to October 2020.1
- Zillow expects home values will rise 13.6% in the next twelve months.2
 Home Supply
- For October, the total number of homes listed for sale in the United States was 1,279,187, down 14.8% from October 2020.1
- The number of new weekly listings for October was 378,048, which is down 2.33% from October 2020.1
Purchases of New Homes Rose
- New single-family home sales increased 14.0% to 800,000 units seasonally adjusted annual rate (SAAR) in September from a revised 702,000 units in August, 17.6% lower than in 2020.
- Average sales for the first three quarters of 2021 were 791,000 units (SAAR) which is below the 2020 annual sales pace of 822,000.3
Sales of Existing Homes Rebounded
- September sales of all existing homes (single-family, townhomes, condominiums, and cooperatives) rose 7.0%, according to the National Association of Realtors® (NAR).3
- The October 2021 pace of 6.29 million units (SAAR) was up from a pace of 5.88 million in August. However, it is 2.3% below last year.3
- The average sales pace through September of this year, at 6.00 million units (SAAR), is higher than the 5.64 million units sold in 2020.6
Days on the Market
- In October, the median number of days a home stayed on the market (from listing to closing or being taken off the market) was 45 days.
- Compared to October 2020, this is a decline of 8 days (15.09%).1
New Home Construction Declined
Total housing starts decreased 1.6% to 1.56 million units (SAAR) in October but were up 7.4% year-over-year.3
- Single-family housing starts remained the same at 1.08 million homes (SAAR) in September 2021.
- The number of single-family housing starts is 2.3% lower than September 2020.
- Multifamily housing starts (5+ units in a structure), at 467,000 units (SAAR), were down 5.1%.
- However, multifamily housing is 38.2% higher than last year.
Year-Over-Year House Price Increases Slowed Slightly
- The Federal Housing Finance Agency (FHFA) seasonally adjusted purchase-only house price index for August estimated that home values increased 1.0% from July and 18.5% over 2020. That is down from a 19.2% annual gain in July.7
- August is the first month that annual price gains slowed after accelerating the fourteen previous months.7
- The FHFA index shows that U.S. home values are 56% above the peak set in April 2007 during the housing bubble.7
The Inventory of New Homes for Sale Remained the Same
- The listed inventory of new homes for sale was 379,000 units at the end of September and unchanged from August. However, this is up 32.5% year-over-year.3
- The September sales pace of new home inventory will support 5.7 months of sales at the current pace, down from 6.5 months in August.3
- September’s inventory of available existing homes for sale was 1.27 million units, down slightly (0.8%) from August, which is 13.0% lower than 1.46 million units in 2020.3
The 30-Year Fixed-Rate Mortgage (FRM) Declined Slightly
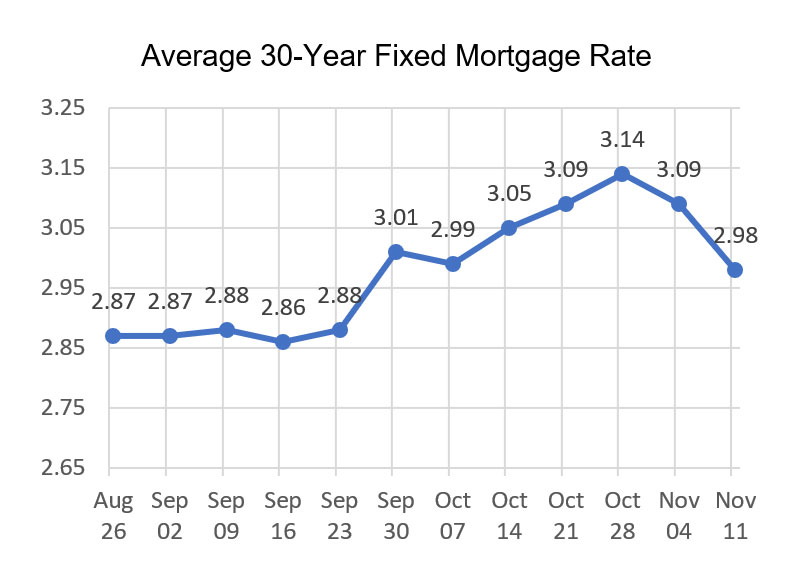
- The 30-year fixed-rate mortgage (FRM) averaged 2.98% with an average 0.7 point for the week ending November 10, down from the previous week when it averaged 3.09%.4, 5
- The record weekly low interest rate was 2.65% for the week ending January 7, 2021.
- The 30-year FRM was 2.81% at this time in 2020.

Sources:
1 Realtor.com residential listings database
2 Zillow
3 HUD Housing Market Indicators Monthly Update, October 2021
4 Freddie Mac
5 FRED, Federal Reserve Bank of St. Louis
6 Because existing home sales are based on a closing, September sales reflect contract signings in July and August. Interest rates are low, but lean inventories and house price growth are constraining sales.
7 Federal Housing Finance Agency (FHFA)

